
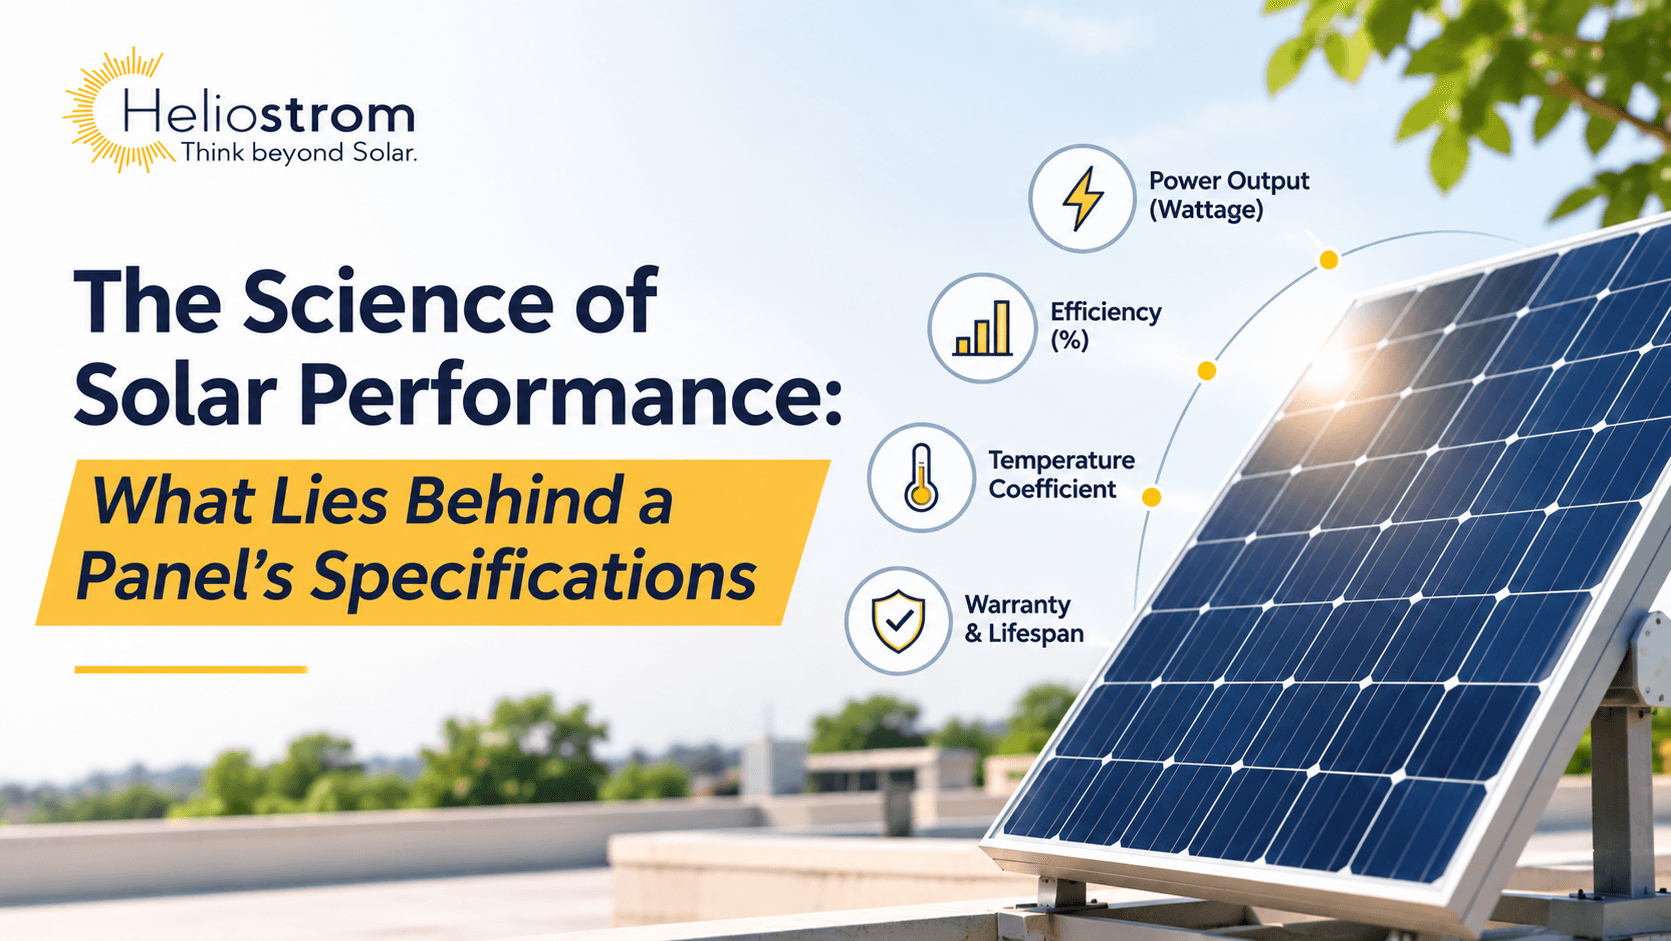
A solar panel datasheet looks like a page of precise numbers, and precision can feel like certainty. A module rated at 550 watts, with 21 percent efficiency and a 30-year warranty, seems easy to compare with the next one on the list. Yet those figures describe behaviour in a laboratory, not on a hot rooftop in May. Anyone who has asked solar panel manufacturers in Chennai for a datasheet soon learns that the lines worth reading closely are not always the ones printed in bold. This guide explains the science behind the main specifications, so you can tell which numbers predict real energy output and which ones only look impressive.
A Datasheet Is a Laboratory Report, Not a Forecast
Every headline rating on a panel is measured under Standard Test Conditions, usually shortened to STC. These specify sunlight intensity at 1,000 watts per square metre, cell temperature at 25 degrees Celsius, and the light spectrum according to a defined reference. Outdoors, that combination almost never happens. Strong sunshine heats the cells far above 25 degrees, so the moment a panel receives full light, it is already operating outside the conditions on which its rating was based.
Why the Second Column Matters
Most datasheets include a second set of figures measured at the nominal module operating temperature, known as NMOT (formerly often called NOCT). These use 800 watts per square metre of light, 20 degrees of ambient air, and a light breeze. Output in this column is often roughly 70 to 80 percent of the STC value, depending on the module, which surprises many buyers. A 550-watt module may deliver somewhere around 400 to 440 watts in that more realistic setting. That is not a defect. NMOT is simply another reference condition that reflects how heat and weaker light change the result, and it is a better starting point than STC for estimating energy, though it is still not a forecast for any particular site.
Efficiency and Power Rating Are Different Measures
Efficiency tells you how much of the sunlight falling on the panel becomes electricity. You can check it yourself: divide the power rating by the module area and by 1,000. A 550-watt module measuring approximately 2.28 by 1.13 metres covers roughly 2.58 square metres, resulting in an efficiency of about 21 percent. Efficiency varies by model, so other 550-watt modules will differ. When two modules share the same wattage, the smaller one is the more efficient.
That distinction matters when roof space is limited, because higher efficiency means more watts from the same area. On a wide-open roof or an open plot, efficiency may matter less than cost per watt and performance in high temperatures. Look at the power tolerance as well. A tolerance of zero to plus five watts means every module should meet or beat its label, whereas a negative tolerance allows some units to fall short.
Temperature Coefficient: The Number That Matters in a Hot City
Silicon cells lose voltage as they warm up, and the temperature coefficient of power describes how much output drops for each degree above 25. It is written as a negative percentage per degree Celsius. As illustrative ranges on typical datasheets, conventional PERC modules show around −0.34 to −0.36 percent per degree, TOPCon modules around −0.29 to −0.32 percent, and heterojunction modules around −0.24 to −0.26 percent. These are not fixed boundaries, since some TOPCon products overlap with PERC and others with heterojunction, so always use the exact value printed for the model you are considering.
A quick calculation shows why this deserves attention. In a place like Chennai, cells in poorly ventilated roof-mounted arrays can reach 60 to 70 degrees on summer afternoons, which is about 40 degrees above the test condition. At a coefficient of −0.35 percent per degree, this means a loss of roughly 14 percent relative to rated power. At −0.26 percent, the loss is closer to 10 percent. A gap of about four percentage points on hot, sunny afternoons adds up over the year, and it is invisible if you only compare watts and efficiency.
Mounting also plays a role. Panels fitted with an air gap behind them shed heat better than panels sitting flat on a surface, and that difference in cell temperature feeds directly into the energy you collect.
PERC, TOPCon, and Heterojunction: What Each Cell Type Changes
PERC technology introduced a passivation layer on the rear of the cell and became widely used over the past decade. TOPCon cells go a step further by incorporating an ultra-thin oxide layer and a doped silicon contact, which reduce electrical losses, improve efficiency, and often lower both the temperature coefficient and the rate of degradation, although the exact figures depend on the manufacturer and product. Heterojunction cells layer thin amorphous silicon on a crystalline wafer and are often among the lowest in temperature coefficient, at a higher manufacturing cost. At the cell level, the first approved cell list in India reported average TOPCon cell efficiencies of roughly 24.6 and 25.3 percent for the two manufacturers listed. Cell efficiency is a different figure from module efficiency, which is always lower once cells are assembled into a panel.
Where India’s Cell Rules Fit In
The Approved List of Models and Manufacturers (ALMM) now covers both cells and modules. Under MNRE’s framework, ALMM List-I modules used in government-supported projects, and in net-metering and open access projects commissioned on or after 1 June 2026, must be built with cells from ALMM List-II, subject to the exemptions the ministry has specified. Compliance depends on the listing status of the module and its cells and on the commissioning date, not on the date printed on a datasheet. In practice, ask for the enlistment details of both the module and its cells, and confirm them against the current official lists before you order, because the models that qualify may be narrower than older catalogues suggest.
Degradation and Warranty: Reading the Fine Print
First-Year Loss
New panels may experience a small reduction in output shortly after they begin operating, due to initial stabilisation effects and light-induced or light and elevated temperature induced degradation in the silicon. Datasheets commonly state first-year degradation of about 1 to 2 percent, with newer n-type technologies generally at the lower end, though the mechanism and the figure vary by cell type.
The Annual Decline and the Linear Warranty
After that first year, output falls slowly, often by around 0.4 to 0.55 percent each year, while some newer n-type warranties state a lower rate. You can use the two figures to test the performance warranty. With a 1 percent first-year loss and 0.4 percent a year afterwards, a panel would deliver about 87 percent of its rated power after 30 years, which is what those figures imply as a warranty floor, not a forecast of actual output. A warranty that promises a higher number than the degradation figures support deserves a question.
Also, distinguish between the two types of warranty coverage. The product warranty deals with materials and workmanship and commonly runs from 12 to 25 years depending on the manufacturer and product line. The performance warranty guarantees output over 25 or 30 years, so read the guaranteed percentage at the end of the term and not just the number of years.
Voltage and Current Ratings That Shape the Whole System
Open-circuit voltage, short-circuit current, and the voltage and current at maximum power describe how a panel behaves in a string. Voltage drops in heat and rises in cold, while current changes with sunlight and, to a smaller degree, temperature. On a cool morning, a string with too many panels can push the voltage above the inverter’s maximum input limit. On a hot afternoon, a string with too few panels can fall below the inverter’s operating range for power tracking, which reduces efficiency or interrupts generation. Whoever handles solar panel installation in Chennai for you should size strings using the actual temperature extremes of the site and the inverter’s stated limits, rather than generic catalogue defaults.
Durability Ratings That Protect Output Over Time
Certificates are the third pillar of a datasheet. The international standards IEC 61215 and IEC 61730 cover design qualification and electrical safety, respectively, while modules sold in India generally also require BIS registration, so confirm the current notification that applies to your product. For coastal installations, it is worth requesting salt mist testing under IEC 61701, which examines corrosion resistance but does not by itself prove suitability for a specific site. Resistance to potential-induced degradation is evaluated under IEC 62804, so ask for the module-specific test report and its conditions rather than relying on a claim in a brochure.
Mechanical load classes, commonly 2,400 pascals or 5,400 pascals, describe the pressure the frame and glass were tested to, but they are not wind ratings in themselves. Real wind resistance depends on the mounting design, clamps, rails, roof attachment, and structural calculations. A high ingress protection rating on the junction box helps keep moisture out, although connectors, cable glands, and installation workmanship matter just as much during monsoon rain.
One caution applies to every certificate. Confirm that it names the exact model and the manufacturing facility. A certificate alone does not guarantee batch-level traceability, so ask for the serial-number range, factory code, and matching test documents as well.
Bifacial Gain, Half-Cut Cells, and Shade Behaviour
Bifacial modules collect light on the rear surface as well. The bifaciality factor, often between 70 and 80 percent for TOPCon modules, indicates how well the rear side performs compared with the front. It is a property of the module. Bifacial gain is the extra energy actually obtained, and it depends on the surface beneath the panels, mounting height, row spacing, and rear-side shading. A reflective white roof coating or a raised structure over a bright surface can provide an additional boost, while a dark surface directly beneath the panels offers very little benefit.
Half-cut cell designs divide each cell into two, reducing resistive losses and improving partial-shade behaviour. The benefit depends on the bypass diode layout and the shading pattern, so a shaded section can still reduce output noticeably. Bypass diodes are a separate feature that routes current around a shaded part of the module. If your roof has water tanks, ducting, or neighbouring trees, these design details can matter as much as the headline wattage.
Why Small Percentages Add Up on Larger Roofs
Facility managers comparing commercial solar solutions in Chennai often treat a difference of half a percentage point as trivial. Consider a 500 kW system producing roughly 1,450 units per kilowatt each year, a planning assumption rather than a fixed figure for the city. This amounts to approximately 725,000 units of electricity annually. A three percent improvement resulting from a better temperature coefficient and lower degradation could translate into about 21,750 additional units each year. At an illustrative tariff of ₹8 per unit, which varies by consumer category, that is roughly ₹1.7 lakh annually, repeated for decades. Real differences also depend on orientation, shading, soiling, cable losses, inverter efficiency, and maintenance, so a better panel is only one part of the result. Even so, specifications that look minor on paper can become real money at scale.
A Practical Way to Read Any Datasheet
Before you compare prices, run each option through a short checklist:
- Confirm the exact model, wattage class, and cell technology, rather than relying on a brand name alone
- Compare the temperature coefficient of power alongside efficiency
- Ask for output at NMOT as well as STC, so you can estimate realistic generation
- Read the first-year and annual degradation figures and test them against the warranty promise
- Verify that certificates name the specific model and factory
- Check ALMM enlistment for both the module and its cells where your project needs it
Final Thoughts: Look Past the Headline Wattage
Wattage and efficiency are the most prominent figures on a datasheet, but the less noticeable specifications often determine how much energy a panel delivers over its lifetime. Temperature behaviour, degradation, certification, and cell technology together explain why two panels with similar ratings can produce different results on the same roof. Once you understand how to interpret these specifications, a datasheet becomes more than a sales document; it becomes a useful tool for comparison.
If you would like help reading datasheets for your own project, our team can compare specific models against your roof, your climate, and your budget. Contact us to talk through the specifications that matter most for your system.
Thinking about your own installation? rooftop solar installation for homes in Chennai or book a free site survey.


