
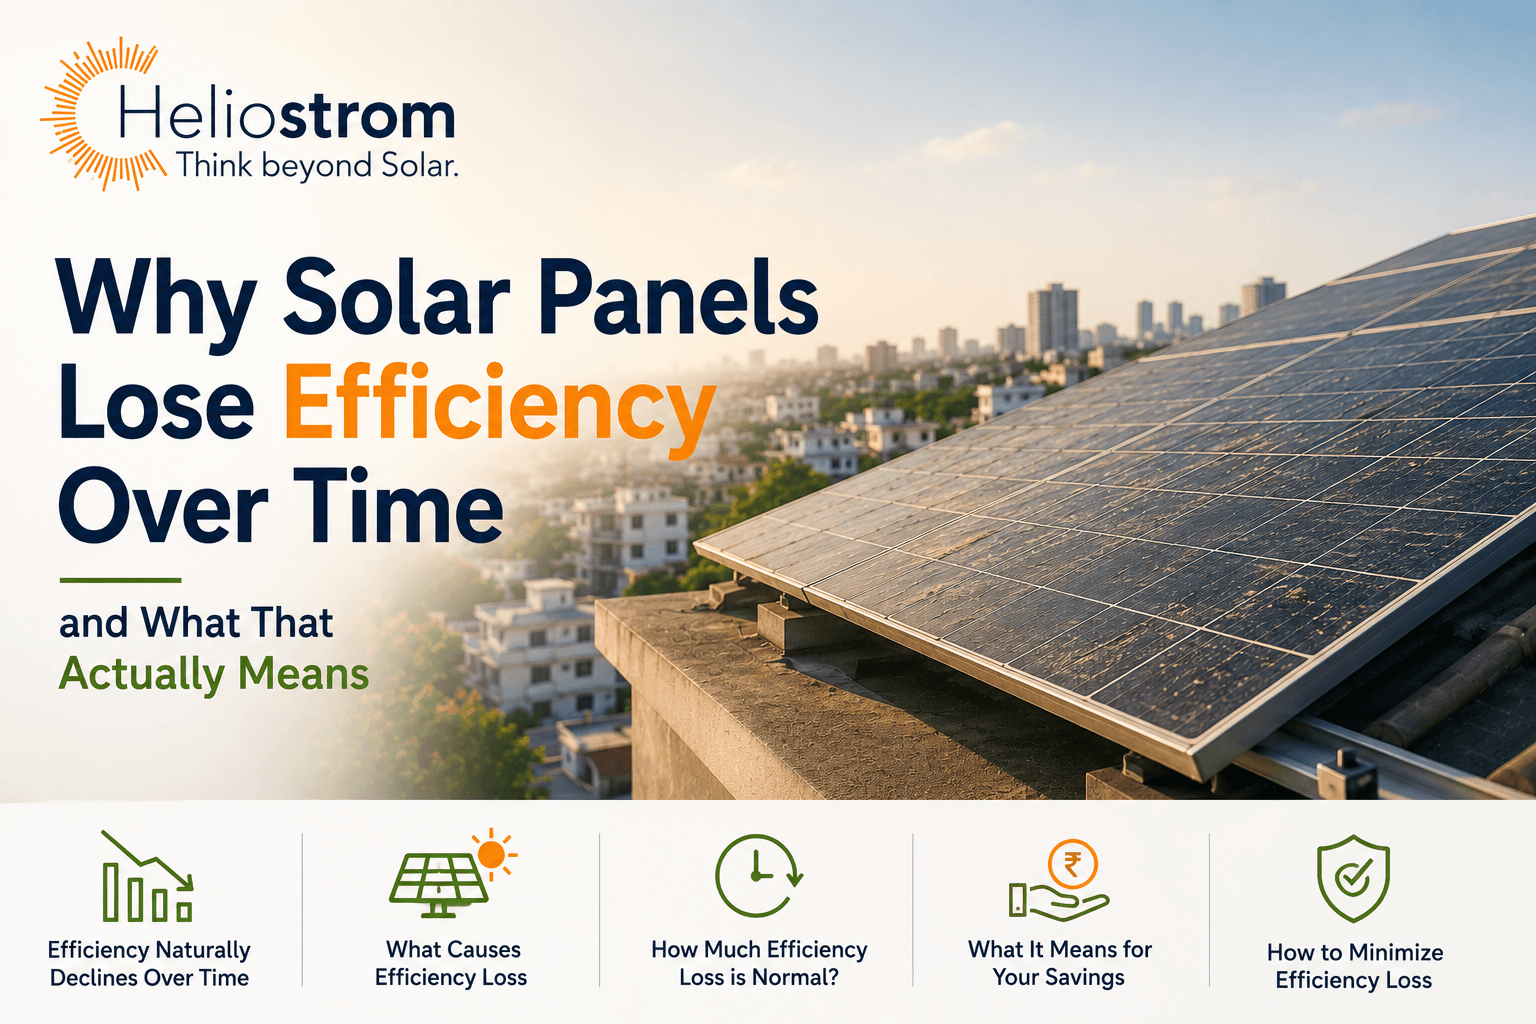
Every solar panel produces slightly less electricity in its tenth year than it did on the day it was switched on. This is expected, it is measurable, and it is built into every performance warranty issued today. Yet the word degradation still makes many first time buyers uneasy, as if it points to a defect rather than normal ageing. Established solar panel manufacturers in Chennai account for this decline at the design stage, which is why understanding what causes it, how fast it actually happens, and what it means for your long term savings is far more useful than worrying about it. This article breaks down the science behind panel ageing and what it genuinely means for a rooftop or ground mounted system installed today.
What Losing Efficiency Actually Means
Degradation Is Not the Same as Failure
Degradation refers to a gradual, predictable drop in a panel's power output over time, not a sudden malfunction. A panel rated at 550 watts on day one might produce closer to 540 watts after five years and around 495 watts after twenty five years, while still functioning perfectly and safely. This is fundamentally different from a defective panel, which shows a sharp, irregular drop in output or stops generating altogether, usually pointing to a manufacturing fault, physical damage or a wiring issue rather than normal ageing.
How Degradation Is Measured
Manufacturers express degradation as an annual percentage loss in rated output, tested under standard laboratory conditions and confirmed through long term field data. A panel with a 0.4 percent annual degradation rate is expected to retain roughly 90 percent of its original output after twenty five years. This figure is usually printed directly into the performance warranty, alongside a guaranteed minimum output at specific milestones such as year ten and year twenty five.
The Science Behind Panel Degradation
Light Induced Degradation
Light induced degradation, often shortened to LID, occurs mainly in older generation p-type silicon cells, where boron and oxygen impurities interact under sunlight exposure in the first few hours and days of operation, causing an initial output drop of roughly one to three percent before the panel stabilises. Newer n-type technologies such as TOPCon and heterojunction cells use phosphorus doped silicon instead, which largely avoids this early stage loss altogether.
Potential Induced Degradation
Potential induced degradation, or PID, happens when a voltage difference builds up between the solar cells and the earthed metal frame, particularly in humid environments and high voltage string configurations. Over time, this can cause ion migration within the cell that reduces power output. Quality encapsulant materials, proper grounding and, increasingly, inverter level PID recovery features have made this a far less common issue on well installed systems than it was a decade ago.
Thermal Cycling and Microcracks
Panels expand slightly in daytime heat and contract at night, and this repeated cycling, day after day for twenty five years, can eventually create tiny fractures in the solar cells or their soldered connections. A single microcrack rarely affects output noticeably, but poor handling during transport or installation can accelerate this ageing mechanism well before its time.
UV Exposure and Encapsulant Ageing
The transparent encapsulant layer that protects the cells gradually yellows and loses clarity under constant ultraviolet exposure, slightly reducing the amount of light that reaches the cells beneath. This is a slow, cumulative effect rather than a sudden one, and it is one of the main reasons degradation curves are never perfectly flat, even for well built panels.
How Much Efficiency Do Panels Actually Lose
Typical Annual Degradation Rates by Technology
Real world data compiled by research bodies such as NREL, along with manufacturer warranty documents, generally place older mono PERC panels in the range of 0.5 to 0.7 percent annual degradation, while modern n-type TOPCon panels typically fall between 0.3 and 0.4 percent, and heterojunction, or HJT, panels often perform even better at around 0.25 to 0.35 percent per year. Most panels also show a slightly higher first year loss, often close to 1 percent, before settling into this steadier long term rate.
What This Means Over Twenty Five Years
The gap between these numbers compounds meaningfully over a system's lifetime. A panel degrading at 0.7 percent a year retains roughly 82 to 85 percent of its original output by year twenty five, while a panel degrading at 0.35 percent retains closer to 91 to 92 percent. On a large commercial installation, that difference can translate into a noticeable gap in lifetime energy yield, which is why the degradation rate quoted in a warranty is worth comparing as closely as the price per watt.
Factors That Accelerate Degradation in Indian Conditions
Heat and Climate
Solar cells lose efficiency as their temperature rises above standard test conditions, and prolonged exposure to high ambient heat, common across much of India for large parts of the year, can add to long term wear beyond the base degradation rate. Adequate air gap beneath the mounting structure helps dissipate heat and reduces this added stress on the cells.
Dust, Soiling and Coastal Salinity
Dust accumulation temporarily reduces output but does not itself cause permanent degradation, provided panels are cleaned on a reasonable schedule. Coastal and industrial sites, however, face a genuine long term risk from salt laden air and airborne pollutants, which can corrode frames, connectors and junction boxes over the years if components are not rated for that level of exposure.
Poor installation and maintenance practices are among the most preventable causes of accelerated ageing. Loose connections, inadequate earthing, incorrect torque on mounting hardware and skipped inspections all shorten a panel's effective working life well before its rated warranty period ends. Businesses evaluating vendors for a large rooftop or ground mounted plant often find it useful to look at an installer's solar panel installation experience and manufacturing background rather than relying on price alone, since component quality and workmanship have a far bigger long term impact on output than most buyers initially assume.
Why Degradation Does Not Mean a Bad Investment
Even a panel operating at 85 percent of its original output after twenty five years is still generating substantial, largely free electricity well beyond the point where the system has already paid for itself, typically within three to six years for most commercial installations. Degradation is priced into every serious financial model from the outset, so a well designed system continues to deliver strong returns for decades, not just for the years before output begins to taper.
How to Slow Down Degradation
While some ageing is unavoidable, several practical steps meaningfully slow it down: choosing Tier 1 modules with a documented low degradation rate, ensuring proper grounding and PID resistant components at the design stage, scheduling regular cleaning and thermal imaging inspections, and avoiding unnecessary shading or physical stress on the array. None of these eliminate degradation, but together they keep a system tracking closer to its best case curve rather than its worst case one.
Monitoring plays an equally important role. A plant fitted with string level or panel level monitoring makes it possible to spot a single underperforming module long before it drags down the output of an entire array, since a shaded or partially faulty panel in a series string can quietly reduce the yield of every panel connected to it. Catching this early, through periodic data review rather than waiting for a visibly lower electricity bill, is one of the simplest ways to protect long term generation without any additional hardware cost.
Comparing Degradation Numbers Across Quotes
When two vendors quote similar pricing per watt, the degradation rate and warranty structure are often what actually separate a good deal from a mediocre one. A buyer comparing quotes should ask for the exact annual degradation percentage in writing, whether the warranty is linear or stepped, and what output is guaranteed at year ten, year twenty and year twenty-five specifically, rather than accepting a single headline efficiency number on a brochure. For businesses evaluating solar solutions for commercial buildings, these details rarely change the upfront cost significantly, but they can shift lifetime energy yield by several percentage points, which matters far more for a plant expected to run for a quarter of a century.
Reading and Understanding Your Warranty
A performance warranty is the clearest signal of how a manufacturer expects its panels to age. Look specifically for whether the guarantee is linear, meaning output must not fall below a straight line trajectory at any point over the warranty term, rather than only guaranteeing an endpoint figure at year ten or twenty five. A linear guarantee is generally a stronger indicator of consistent, predictable performance than a stepped one, and it is worth asking any vendor to walk you through the exact curve before you sign a purchase order.
Conclusion
Solar panels are not designed to perform at full output forever, and they were never meant to. What matters is that the decline is slow, predictable and already factored into the economics of your investment from day one. Understanding the mechanisms behind degradation, LID, PID, thermal cycling and UV ageing, along with the actual numbers involved, helps set realistic expectations and makes it far easier to compare panels on genuine long term value rather than headline efficiency alone.
If you want a system engineered around realistic long term output rather than best case numbers alone, contact us and our team can walk you through component selection, warranty terms and expected performance for your site.
Want these savings on your own roof? get a free solar quote or explore home solar in Chennai.


